
Figure 5.
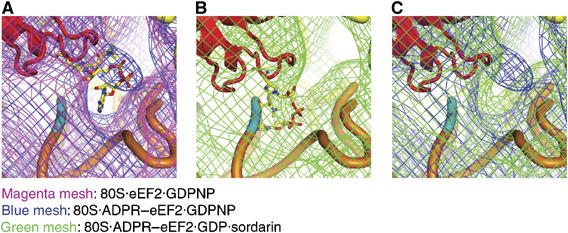
Docking of the X-ray structure of the ADPR moiety into the cryo-EM density map. (A) Comparison of the density obtained from the eEF2 (magenta mesh) and ADPR-eEF2 (blue mesh) maps, both with GDPNP, shows that density attributed to the ADPR occupies the ribosomal A site before GTP hydrolysis. (B) Fitting of the ADPR moiety after GTP hydrolysis in the 80S·ADPR-eEF2·GDP·sordarin cryo-EM density was facilitated by superimposition of domain IV of the ADPR-eEF2·exotoxin A crystal structure (Jorgensen et al, 2005). The docked ADPR moiety is well accounted for by extra density in this map. (C) A comparison of density obtained from the 80S·ADPR-eEF2·GDPNP (blue mesh) and 80S·ADPR-eEF2·GDP·sordarin (green mesh) complexes indicates that the ADPR moiety moves out of the A site, and into helix 44, after GTP hydrolysis. In all panels, ADPR-eEF2 is red, the ADPR moiety is colored according to atom composition, SSU rRNA is yellow, helix 44 of the SSU is orange, with the phosphate backbone of the conserved adenines in helix 44 (A1492 and A1493 in E. coli) colored cyan.