
Figure 3.
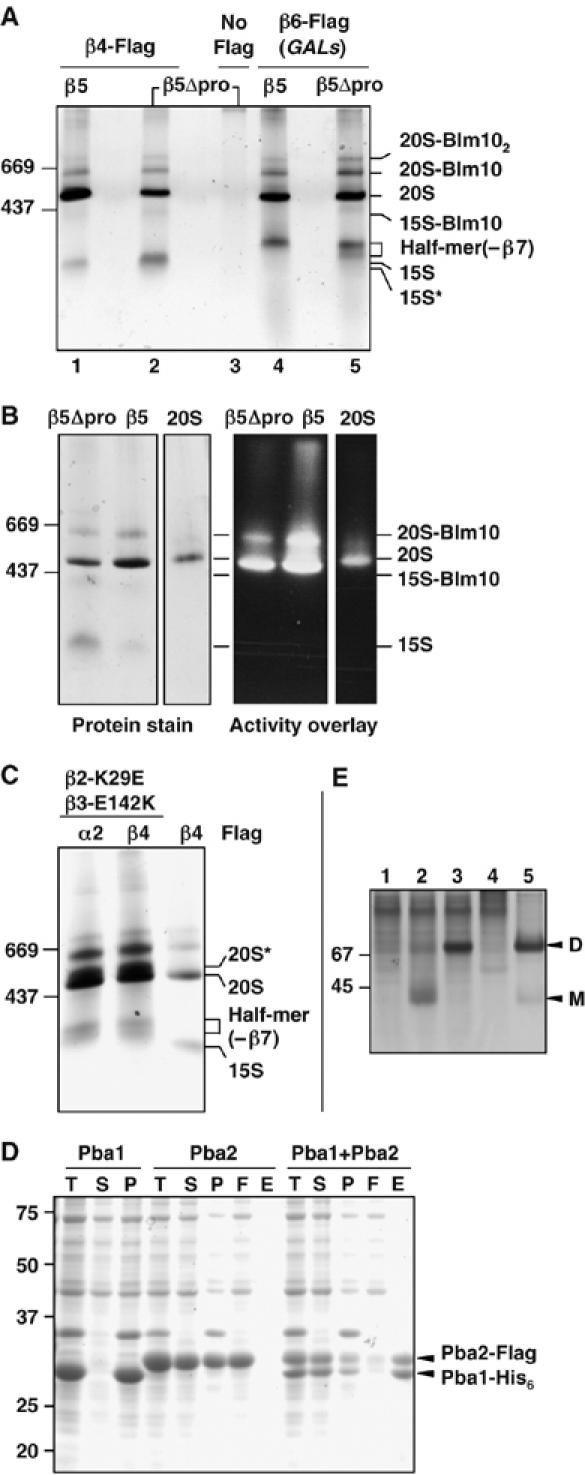
Native gel analysis of affinity-purified proteasomal particles. (A) GelCode Blue-stained native gel showing affinity-purified protein complexes. Extracts from yeast β5 or β5Δpro cells with either Flag-His6-tagged β4 (lanes 1 and 2) or β6 proteins (lanes 4 and 5) that also expressed β7 from a high-copy plasmid were purified on an anti-Flag affinity column. Control purification from untagged cells is shown in lane 3. (B) Native gel stained for protein (left) and assayed for peptidase activity by an activity overlay assay with the fluorogenic LLVY-AMC substrate (right). Conventionally purified 20S proteasomes (‘20S') were used for comparison. (C) Protein complexes affinity-purified with anti-Flag from β2-K29E β3-E142K cells and resolved on a GelCode Blue-stained native gel (first two lanes). For comparison, an anti-Flag purification from β5Δpro cells is also shown (last lane). (D) Pba1 and Pba2 bind directly to one another (GelCode Blue-stained SDS gel). T, total cell lysate; S, soluble fraction; P, pellet; F, Ni-NTA column flow-through; E, eluate from Ni-NTA. (E) Pba1 and Pba2 form a heterodimer. E. coli lysates expressing the following proteins were resolved by native PAGE (10%) and visualized with GelCode Blue: 1, Pba1-His; 2, Pba2-Flag; 3, Pba1-His+Pba2-Flag; 4, control lysate; 5, partially purified Pba1-His–Pba2-Flag complex. D, dimer; M, monomer.