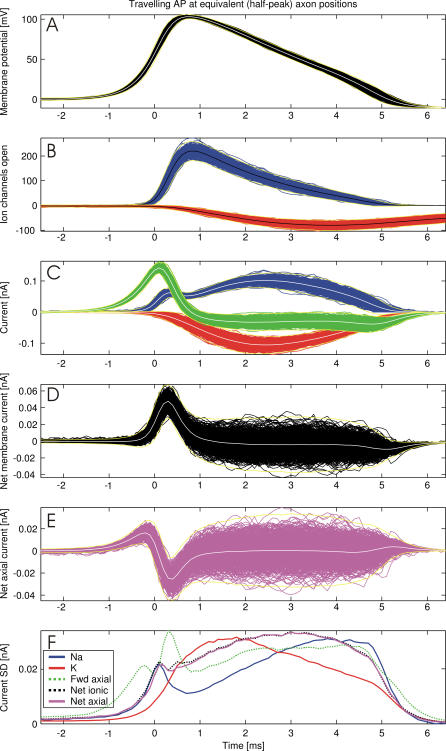
Figure 3. Variability of the Propagating AP Aligned at Half-Peak Membrane Potential (t = 0 ms, Data for 0.3 μm Diameter Axon, White/Black Curves Are Arithmetic Averages and Yellow Curves are 3 × SD Envelopes, N = 673).
(A) Membrane potential wave forms.
(B) Open Na (blue) and K (red) channels.
(C) Ionic currents flowing through the membrane (Na current, blue; K current, red) and axial current (green).
(D) Net membrane current calculated as the sum of Na, K, and leak currents.
(E) Net axial current is the sum of inflowing and outflowing axial currents, describing where axial current is produced (negative values) or consumed (positive values).
(F) SDs of the currents in (C–E), color coding as above. Data shown are the overlayed traces of a single AP propagating along 711 axonal compartments. See text for details.

