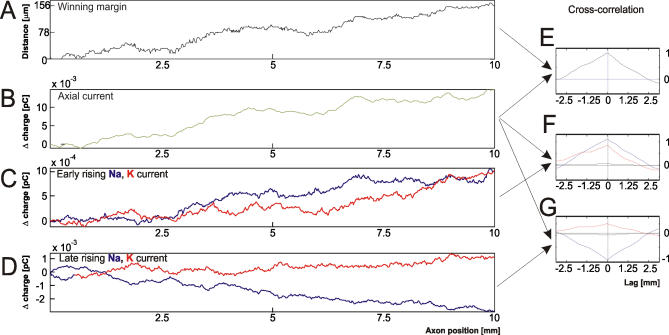
Figure 4. Comparison between the Fastest and the Slowest AP Out of 250 Single AP Trials.
Data shown for a 0.3 μm diameter axon (average diameter of cortical axon collaterals).
(A) Margin between the faster and slower AP wavefront after propagating the same amount of time.
(B) Difference in the charge supplied by Na (blue) and K (red) channels between the foot of the AP and half-peak.
(C) Difference in the charge supplied by Na (blue) and K (red) channel between half-peak and peak of the AP wavefront.
(D) Difference of the axial charge generated at identical points in time.
(E–G) Show the unbiased cross-correlations between the quantities depicted in (A–D), as indicated by the connecting arrows and color coding.

