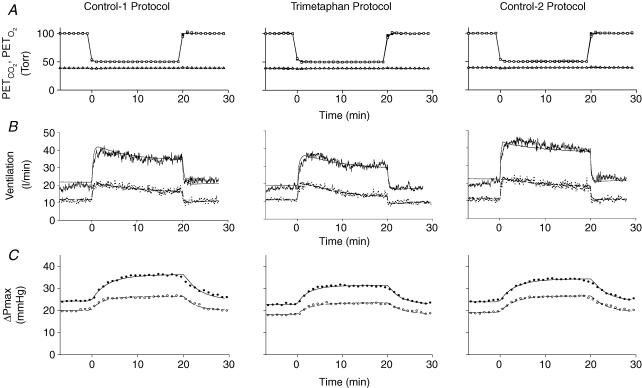
Figure 2. Mean values for end-tidalPO2(PET,O2) (squares) and end-tidalPCO2(PET,CO2) (triangles) (A), ventilation (B) and maximum systolic pressure difference across the tricuspid valve (ΔPmax) (C) during acute hypoxic exposures.
Open symbols and dashed lines indicate responses before sustained hypoxic exposure and filled symbols or continuous lines indicate responses after sustained hypoxic exposure. Lines through data for ventilation indicate fit of respiratory model to data. Lines through data for ΔPmax indicate fit of pulmonary vascular response model to data.

