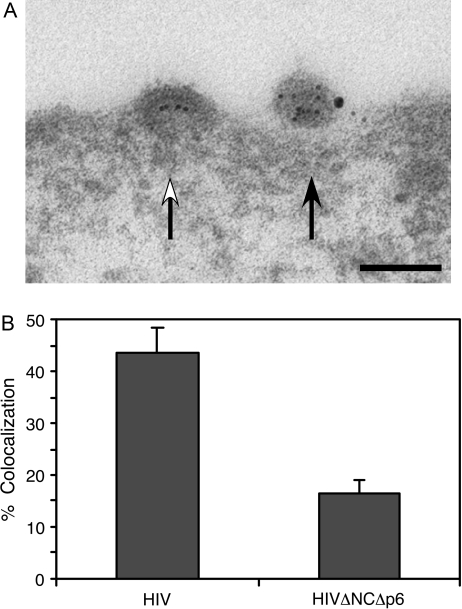
Figure 9: Quantitation of Gag–ABCE1 colocalization at the plasma membrane.
Sections of COS-1 cells expressing HIV or HIVΔNCΔp6 were analyzed for colocalization of Gag and ABCE1. Colocalization was defined as ABCE1 labeling within 100 nm of clusters of Gag labeling at the plasma membrane. A) Examples of negative (white arrow) and positive (black arrow) colocalization of Gag and ABCE1 are shown. Scale bar corresponds to 100 nm. B) Percentage of Gag clusters that were colocalized with ABCE1 was determined for cells expressing HIV versus HIVΔNCΔp6. Error bars show SEM from three experiments. A total of 64 micrographs of wild-type Gag and 44 micrographs of GagΔNCΔp6, each containing multiple Gag clusters, were counted.

