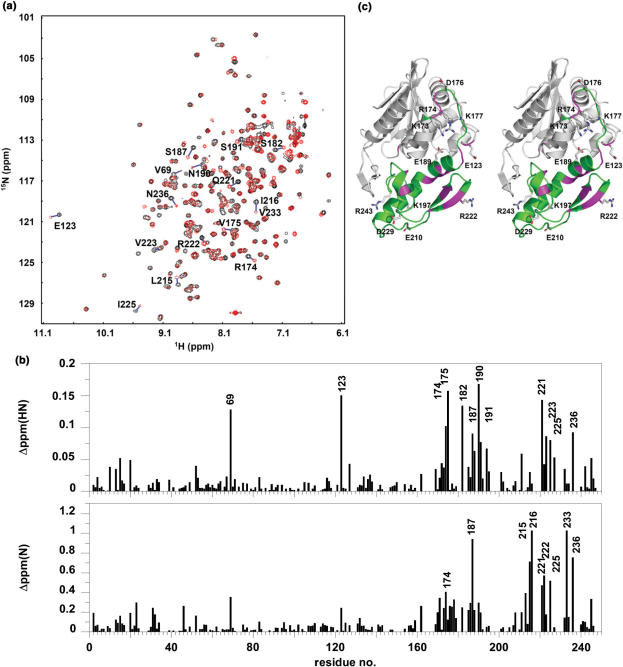
Figure 3.
P2-binding site on TCS was mapped to the C-terminal domain by chemical shift perturbation. (a) 1H–15N correlation spectra of TCS in the absence (black contours) and in the presence (red contours) of equal molar ratio of P2 were compared, and (b) changes in chemical shifts, ▵ppm(HN) and ▵ppm(N), of amide resonances of TCS were measured. Residues with ▵ppm(HN) >0.075 ppm or ▵ppm(N) >0.5 ppm are indicated in (a) and (b), and colour-coded magenta in the stereo diagram of TCS in (c). These residues are localized in or near the C-terminal domain (173–247, colour-coded green) of TCS. Scanning alanine mutagenesis was performed on all charge residues in the C-terminal domain and E123, which are indicated in (c).

