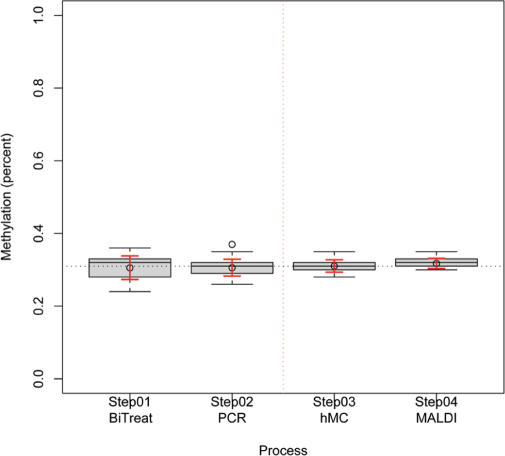
Figure 1.
Box plot graphic depicting the variability of repeated measurements for each step in the process (Step 1: bisulphite treatment; Step 2: PCR; Step 3: MassCLEAVE; Step 4: MALDI-TOF MS analysis). Boxes are centered on the median and range from the lower to the upper quartile. Whiskers indicate the interquartile range. Red whiskers indicate the standard deviation from the mean. Bisulfite treatment and PCR can be identified as the greatest source of process variability. The post-PCR processing (MassCLEAVE) and, in particular, the MALDI analysis show high precision in repeated measurements.

