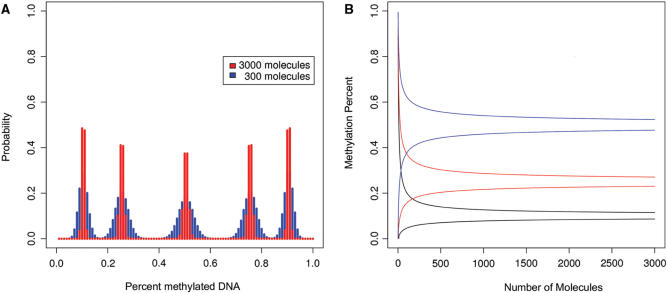
Figure 2.
Panel (A) shows the probability distributions for observed methylation ratios based on the binomial distribution and different amounts of starting molecules. Shown are examples for 10, 25, 50 75 and 90% methylated molecules in the starting template. With a sample size of 3000 molecules, 95% of all randomly sampled probes will contain between 48 and 52% methylated DNA when the DNA sample contains 50% methylated DNA (red colored distribution). However, when the DNA sample contains only 300 molecules, this range is expanded from 43 to 57% (blue colored distribution). Panel (B) shows the 95% confidence intervals for sampling-means as a function of the number of the sampled molecules. Shown are results for 10 (blue), 25 (red) and 50% (black) methylated molecules in the starting template.

