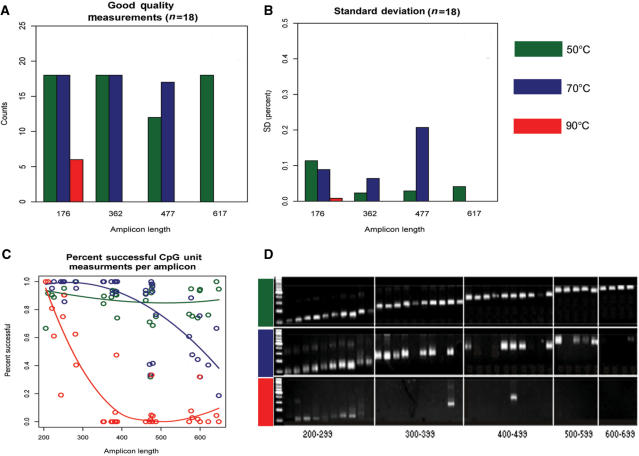
Figure 6.
Correlation between the results obtained from the quality control assays and PCR success from additional genomic targets of varying length. The bar graphs in panel (A) and (B) show the results from the quality control assays similar to Figure 5. The QC assay indicates that incubation at 90°C limits amplification to only short amplicons (<300 bp), whereas incubation at 70°C results in decreased amplification success for amplicons around 500 bp in length. Panel (C) and (D) show results for further 39 PCR amplicons of different genomic regions ranging in length from 200 to 700 bp. Panel (c) shows the percentage of successful quantitative measurements in relationship to the amplicon length. Panel (D) shows a gel picture of the PCR results. Both confirm the results predicted from the use of the QC assay (panel a and b).

