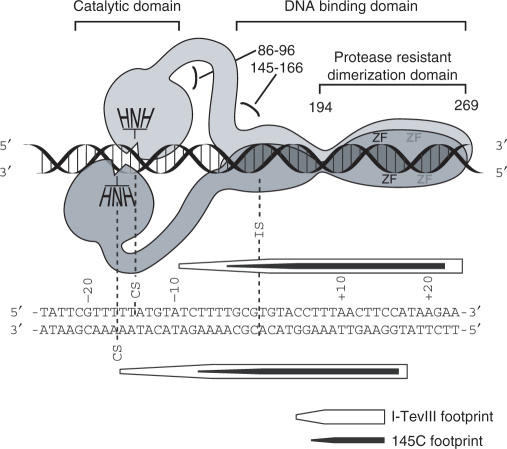
Figure 8.
Dimer model for I-TevIII interacting with its cognate homing site. The model is based on domain analysis, footprinting and stoichiometry data. The sequence below the model represents the homing site, aligned with the model, and showing a summary of the footprint data from Fig. 3C. The numbers near the protein represent amino acid residues. The figure is not strictly to scale, nor do we know the relative orientations of the DNA-binding domains.

