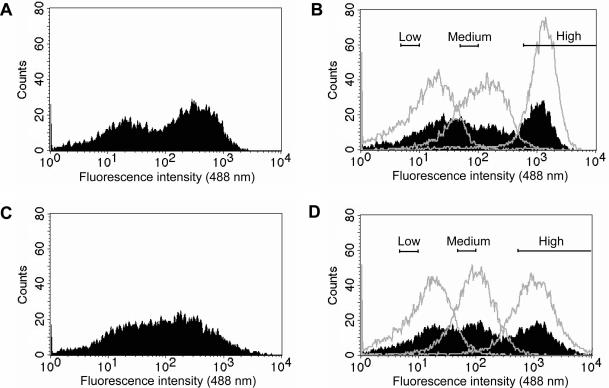
Figure 3.
Histograms from initial flow cytometric analyses of ExLib1 and ExLib2. Induced shake flask cultures were harvested after 4.5 h of induction and analyzed. (A) Analysis of ExLib1; (B) Analysis of previously isolated and here re-cultured ExLib1 subpopulations denoted low, medium and high (gates once used for the sorting are shown), cultured either in separate flasks (non-filled histograms) or together in a common flask (co-culture) (filled histogram); (C) Analysis of ExLib2; (D) Analysis of previously isolated and here re-cultured ExLib2 subpopulations denoted low, medium and high (gates once used for the sorting are shown), cultured either in separate flasks (non-filled histograms) or together in a common flask (co-culture) (filled histogram). The pre-amplifier gain was set to 799 V and the experiments were performed at least twice with similar results (data not shown).

