Figure 4.
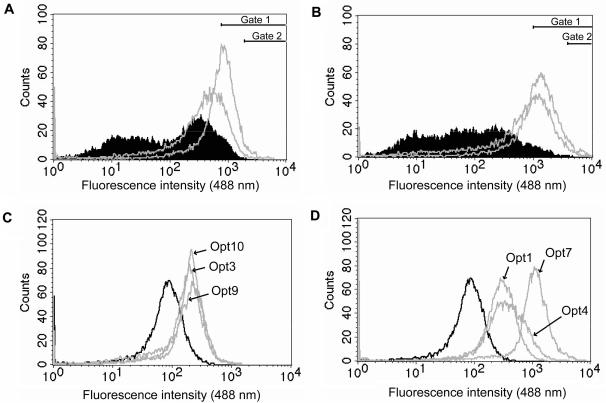
Histograms from flow cytometric sortings of optimized fluorescence clones (Opt) from ExLib1 and ExLib2. (A) Overlay plots from analyses of the original ExLib1 library (filled histogram) and re-cultured subpopulations of the libraries (gray) from after the first (left) and second (right) sorting round for highly fluorescent cells using 488 nm fluorescence gate values of >800 (gate 1) and >2000 (gate 2), respectively, (B) Overlay plots from analyses of the original ExLib2 library (filled histogram) and re-cultured subpopulations of the libraries (gray) from after the first (left) and second (right) sorting round for highly fluorescent cells using 488 nm fluorescence gate values of >1000 (gate 1) and >4000 (gate 2), respectively; (C) Overlay plots from analyses of the individual clones from the ExLib1 library (gray histograms) and the reference clone pBR-TrpL-ZEGFP (black histogram); (D) Overlay plots from analyses of the individual clones from the ExLib2 library (gray histograms) and the reference clone pBR-TrpL-ZEGFP (black histogram). The pre-amplifier gain was set to 600 V (A and B) or 500 V (C and D).

