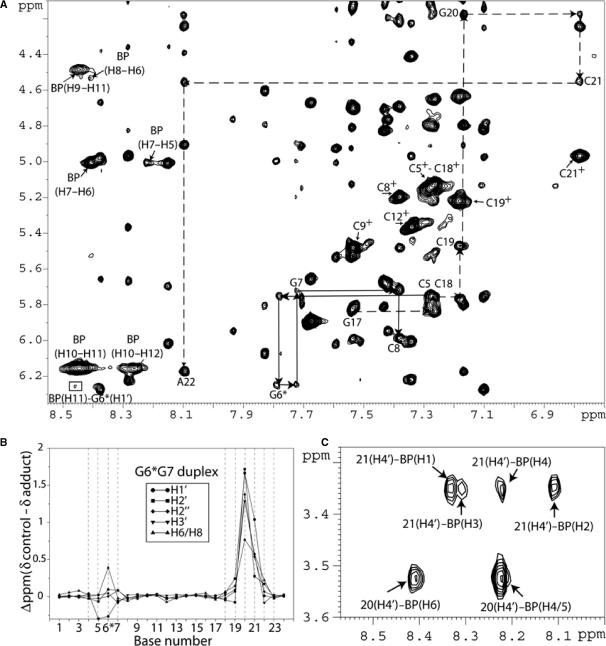
Figure 3.
(A) G6*G7 expanded NOESY (250 ms mixing time) 2D contour plot in 2H2O buffer at 15°C using a Bruker 800 MHz spectrometer. NOE connectivities are shown between a base (purine H8 and pyrimidine H6) proton and their own and 5′-flanking sugar H1′ protons from dC5 to dC8 on the modified strand (solid arrows) and from dG17 to dA22 on the non-modified strand (broken arrows). The NOEs between the 2.45 Å fixed distance H6 and H5 of the cytosine are designated by crosses. Internucleotide base to sugar NOEs, at the non-modified strand, were not identified clearly for G20 → C21 as a result of the overlap of the C19–H6, G20–H8 and T23–H6 protons. There is a tentative assignment of the G20(H1′) and G20(H3′) sugar protons at 4.18 and 3.52 ppm, respectively through NOEs between theses protons and the G20(H2′) and G20(H2″) sugar protons. A cross-peak between the BP(H11)–G6*(H1′) is observed (square box). (B) Graphical representations of the chemical shift perturbations in the G6*G7 duplex relative to the unmodified control 12-mer duplex. Positive values indicate upfield shifts, whereas negative values indicate downfield shifts. (C) NOE cross-peaks between C21(H4′) and BP(H1–H3–H4–H2) protons and between G20(H4′) and BP(H6–H4/5) protons.

