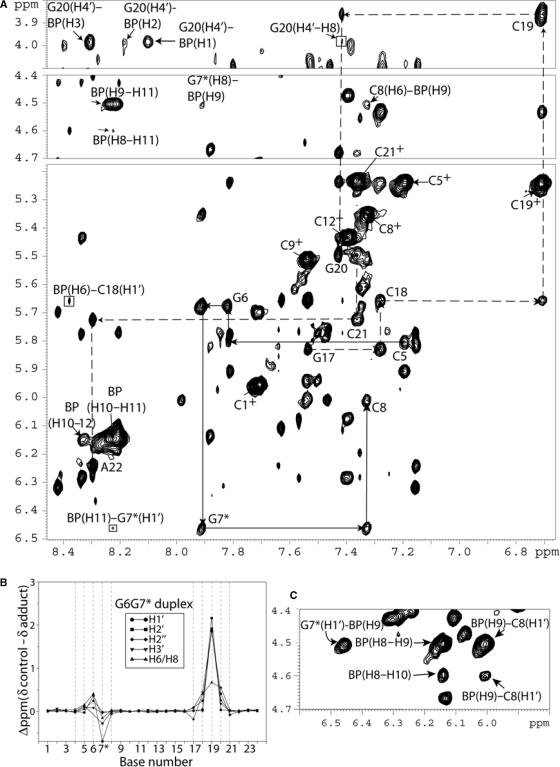
Figure 4.
(A) G6G7* expanded NOESY (250 ms mixing time) 2D contour plot in 2H2O buffer at 15°C using a Bruker 600 MHz spectrometer with a cryoprobe. The NOE connectivities between base protons (purine H8 and pyrimidine H6) and their own and 5′-flanking sugar H1′ protons from C5 to C8 on the modified strand (solid arrows), and from G17 to A22 on the unmodified complementary strand (broken arrows) are shown in the figure. The NOEs between the 2.45 Å fixed-distance H6 and H5 of the cytosine are designated by crosses. Connectivities can be followed on both strands without disruption. Cross-peaks between BP–BP and BP–DNA protons are also shown. The upfield shift of the base and sugar protons at C19 and the corresponding cross-peaks between the BP protons with the C19 and G20 protons suggest that the BP rings is in the minor groove with its major axis pointing toward the 5′-end of the modified strand. (B) Graphical representations of the chemical shift perturbations in the G6G7* duplex relative to the unmodified control 12-mer duplex. Positive values indicate upfield shifts, whereas negative values indicate downfield shifts. (C) NOE connectivities G7*(H1′)–BP(H9), BP(H9)–BP(H10), BP(H8)–BP(H10), BP(H9)–C8(H1′) and BP(H8)–C8(H1′).

