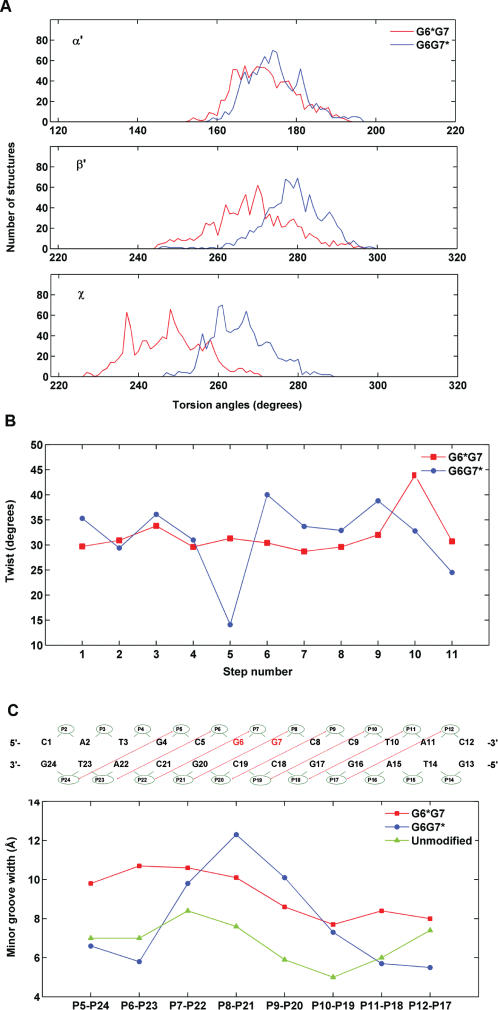
Figure 7.
Differences in structural parameters in G6*G7 and G6G7* duplexes. (A) Distributions of the carcinogen–DNA linkage site and glycosidic torsion angles α′, β′ and χ for the G6*G7 (red), and G6G7* (blue) duplexes. The analysis was based on each frame of the final 1 ps unrestrained MD simulations after intensity refinement. The indicated values are ensemble averages. (B) Minor groove widths of the modified duplexes. The definitions of the minor groove widths for the G6G7 12-mer duplexes is illustrated above the figure. The minor groove widths are the distance between phosphate groups P5 and P24, P6 and P23, P7 and P22, etc. The values shown were obtained after subtracting 5.8 Å from the pairwise distances to account for the van der Waals radius of the P atoms (34). The minor groove widths of the unmodified control were obtained from an unrestrained 3.0 ns simulation of the unmodified sequence (Cai et al., unpublished data), using the last 1.5 ns of production. (C) Computed ensemble average of Twist angles for the G6G7* and the G6G7* duplexes. The numbering scheme for the nucleotide base pair steps is that C1 · G24 to A2 · T23 is step 1, A2 · T23 to T3 · A22 is step 2, … and so on. The minor groove widths and Twist angles were calculated using MD Toolchest (35).

