Fig 3.
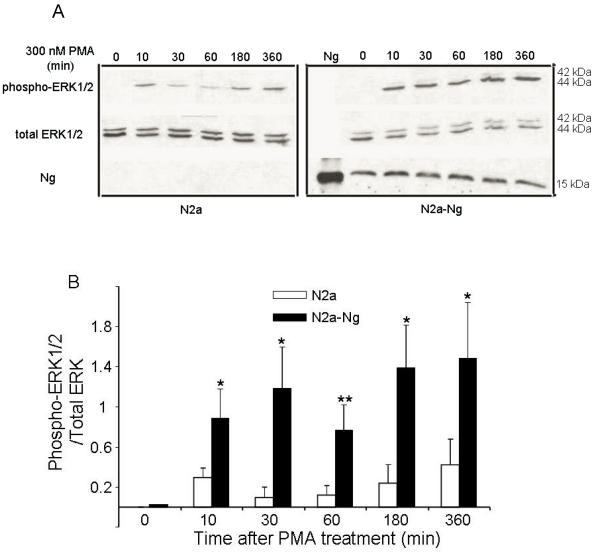
The expression of Ng induced sustained activation and up-regulation of ERK1/2 phosphorylation by PMA treatment in Neuro-2a-Ng cells. The time points after the treatment of 300 nM PMA were shown above. The phosphorylation of ERK1/2, total ERK1/2 and Ng expression level were detected by Western blot analysis (10 μg of protein/lane) (A). The quantitation of Western blot images of the ratio between phospho-ERK1/2 and total-ERK was shown in B. *p < 0.05 and **p < 0.001, comparing Neuro-2a-Ng to Neuro-2a cells (n = 3).

