
Figure 4. Tumor growth with respect to irradiation.
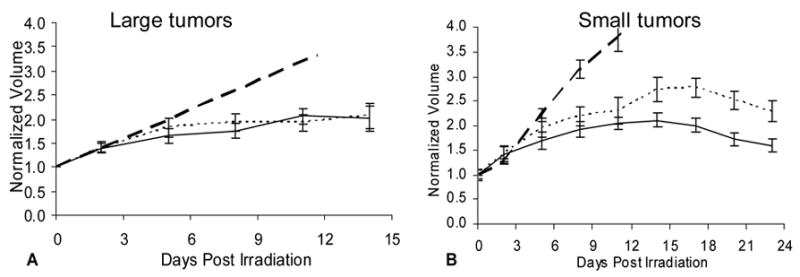
Mean interpolated volume ± SE as a function of time, with each tumor normalized to its initial size at irradiation (Day 0).
A: For large AT1 tumors, no significant growth delay (α =0.05) was observed for tumors on oxygen breathing rats (solid) as compared to air breathing (dotted). Dashed line shows predicted growth of control tumors.
B: For small AT1 tumors, oxygen inhalation during irradiation (solid) resulted in a statistically significant (p<0.001) growth delay, which was evident by day 13 compared with air breathing rats (dotted). Both groups also showed significant delay compared with non-irradiated controls by day 7.