
Figure 5. Influence of oxygen on tumor growth following irradiation.
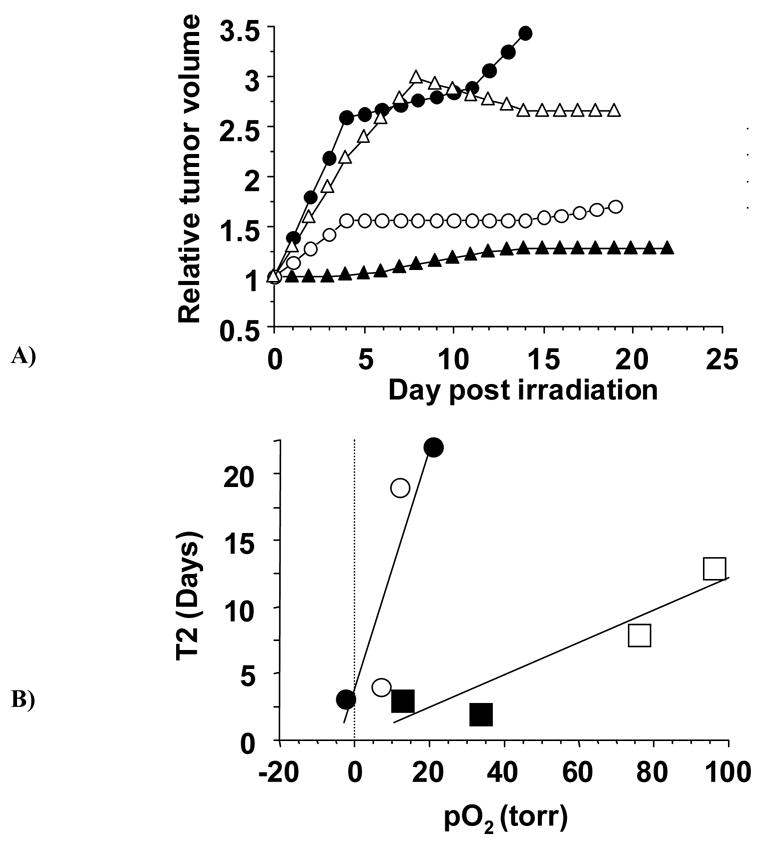
A: Growth of four large AT1 tumors following irradiation indicating different growth delays depending on pO2. Those with solid symbols were on rats breathing air during irradiation, but had very different pO2 values: ▲(pO2 = 21 ± 2 (SE) torr) ● (pO2 = −2.3 ± 0.6 torr (< 1 torr; p>0.99). Open symbols were on rats breathing oxygen during irradiation: o (pO2 = 12 ± 5 torr) △ (pO2 = 7 ± 2 torr).
B: Correlation between T2, the time to double in size following irradiation and pO2 measured pretreatment. Separate curves are shown for small and large tumors, each of which shows a strong correlation (R2>0.8). Large tumors are shown as circles and small tumors as squares, open symbols for rats breathing oxygen and closed for air.