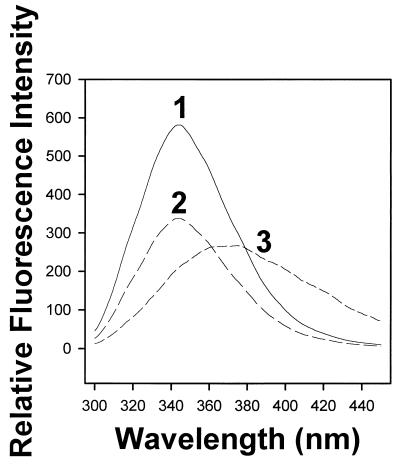
Figure 3.
Fluorescence spectroscopy of human αB-crystallin in the presence and absence of ATP. Shown are emission spectra for human αB-crystallin in the absence of ATP (trace 1) and in the presence of 350 μM and 3.5 mM ATP (traces 2 and 3, respectively). A similar decrease in peak fluorescence intensity was observed for human αB-crystallin in the presence of 350 nM-350 μM ATP (data not shown). Quenching was observed at concentrations of ATP between 350 nM and 350 μM whereas 3.5 mM ATP resulted in both quenching and a red shift. Spectra were corrected for background emission Raman scattering. Spectra of the buffers (including ATP) were subtracted from the spectra of the protein samples.

