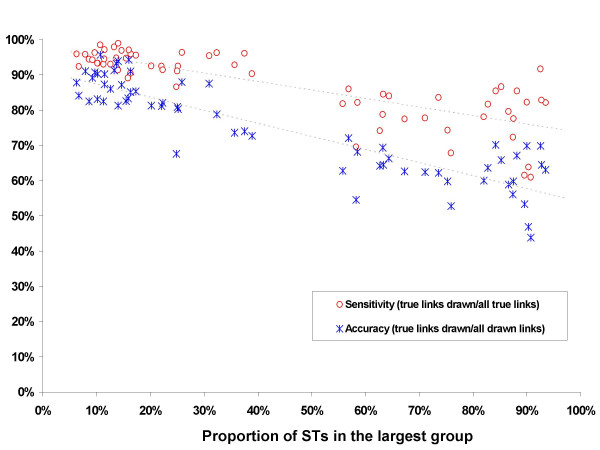
Figure 6.

Relationship between the performance of eBURST and the proportion of STs in the largest group. Ten realisations of each simulation were generated with different combinations of ρ and θ. Random samples of 500 isolates were drawn from the population of 1000 isolates at 500 generation intervals after generation 5000.
