Figure 3.
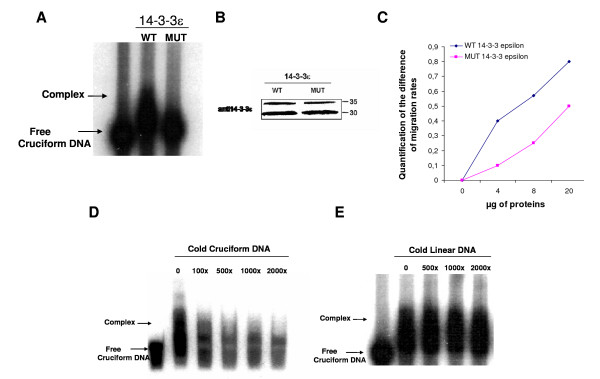
Cruciform-binding activity of 14-3-3ε. Band shift assays were carried out as described in Methods. A- 3 ng of 32P-labelled cruciform DNA was incubated in the presence of 20 μg of wild-type (lane2) or mutant (lane 3) total whole cell extracts. Free cruciform DNA denotes the position of the probe alone. B- Western blot of proteins eluted from band-shifts initially performed with 300 ng of labelled cruciform DNA, and probed with anti-14-3-3ε antibody (see Methods). C- Representative protein concentration curve using increasing amounts of total WCE containing wild type or mutant 14-3-3ε proteins incubated with 3 ng of cruciform DNA. Differences of migration rates of the shifted complexes with free cruciform DNA are represented with arbitrary units. D-E- Competition binding assays were carried out as described in Methods. Cold cruciform DNA (D) and cold linear DNA (E) competitors were added in the indicated amounts in a reaction with wild type 14-3-3ε. Free cruciform DNA denotes the position of the probe alone.

