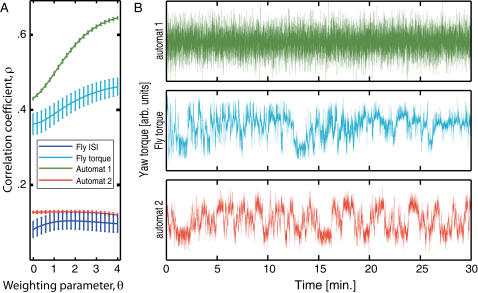
Figure 6. Nonlinearity implies instability.
A–S-Map results. Depicted are the averaged results for fly ISIs and raw yaw torque series (for clarity, only openloop data are shown here), together with two automat simulations. The fly ISI series shows a slightly improved forecast skill with increasingly nonlinear S-map solutions (increasing Θ). Fly yaw torque series yield both a better overall forecast skill as well as increased nonlinear improvement. The automat simulation can be tuned to produce both linear and nonlinear output. B–Sample raw yaw torque data traces from a real fly and the two versions of the simulated agent depicted in A (automat 1, automat 2). S-Map results for the other two groups are depicted in Fig. S5.

