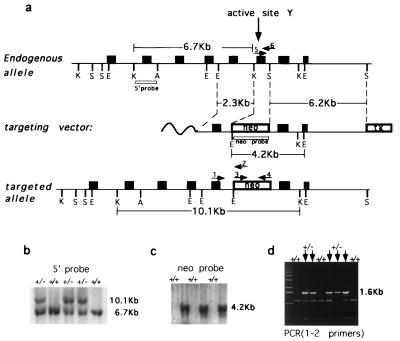
Figure 1.
Targeted disruption of mouse TOP3α gene. (a) Schematics of the region of mouse TOP3α containing the active site tyrosine (Top), the targeting vector (Middle), and the Δtop3α allele after gene disruption (Bottom). Filled boxes represent exons. K, S, E, and A denote KpnI, SspI, EcoRI, and ApaI restriction sites, respectively, and boxes denoted neo and TK represent the neomycin and herpes simplex virus thymidine kinase markers used. The locations of the probes used in blot hybridization (5′ probe and neo probe) and primers used in PCR (arrows numbered 1–6) also are indicated. The nucleotide sequences of primers 1–4 are, respectively, 5′-CGCGGAAAAGCTCTATACACAA-3′, 5′-TGTAGCGCCAAGTGCCAGCGGGG-3′, 5′-CGTGTTCCGGCTGTCAGCGCA-3′, 5′-ATCGCCATGGGTCACGACGAGAT-3′. Primers 5 and 6 are the same as the YPRT and the FSES primer described in Materials and Methods. (b and c) Genotyping of tail biopsies by blot hybridization. (b) KpnI digests were fractionated by agarose gel electrophoresis, and blot hybridization was carried out by using the 5′ probe. (c) EcoRI digests and the neo probe were used. The sizes of the fragments detected are in agreement with those expected from the drawings in a. (d) Genotyping of tail biopsies by PCR, using the pair of primers 1 and 2. The presence of the 1.6-kb product signified the presence of at least one copy of the mutant allele. The leftmost lane contained the “1-Kb ladder” size markers (GIBCO/BRL).

