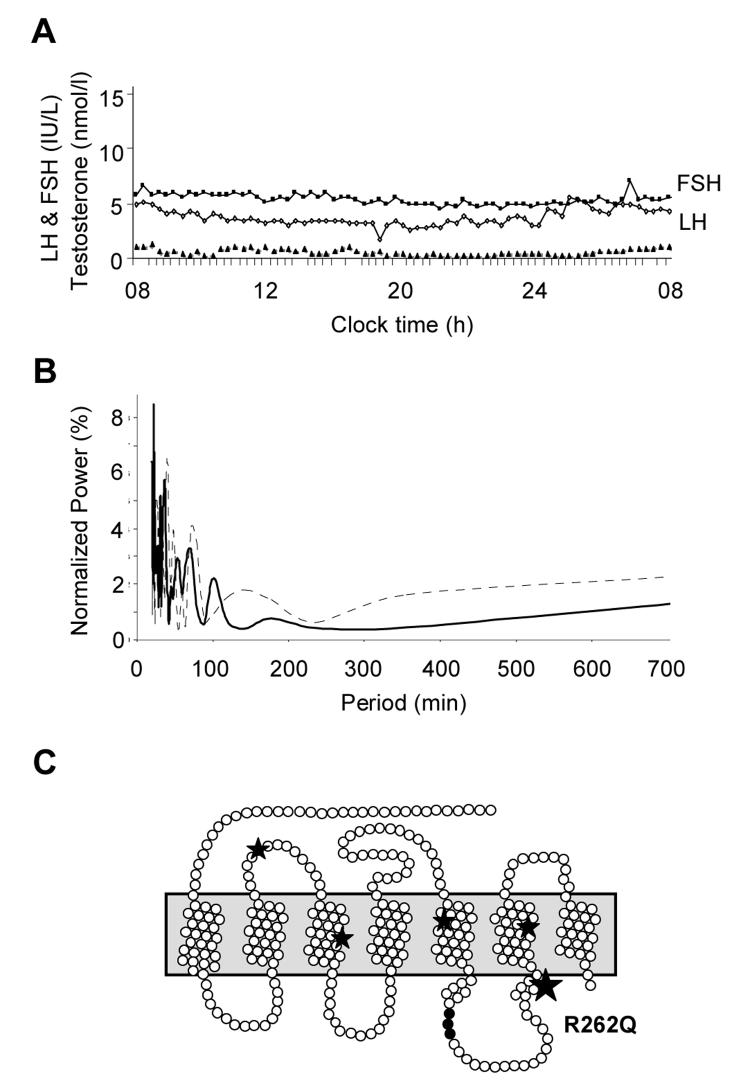
Fig. 2.
A. Profile of spontaneous FSH (IU/l) (■), LH (IU/l) (◇) and testosterone (T, nmol/l) (▲) release (sampling every 20 minutes) over 24 hours in the younger brother with IHH at 15.5 years of age. (testosterone nmol/l × 29 for ng/dl). B. Time series analysis of FSH (solid line) and LH (broken line) revealed a poorly defined rapid Fourier transform of low spectral power. In this analysis, data are first stationarized and log-transformed to remove long-term trends, then Fourier transformation is performed to deconvolute the complex signals into cosine and sine components, which separate and measure the different frequency components of the time series data array. The spectral power is an expression of the relative intensity of the signals at each frequency. A “normal” gonadotropin time series is likely to show dominant pulsatility of 120 mins, with spectral power in the order of 20%. C. Pseudostructural plot of the GnRH receptor showing the position of the highly conserved arginine at position 262 within the third intracellular loop of the receptor. The R262Q change has been described previously in a compound heterozygous state in patients with IHH, together with other disruptive mutations in the receptor (Q106R/R262Q, A129D/R262Q, and R262Q/Y284C). This amino acid is believed to form part of a critical interface with intracellular signaling pathways.

