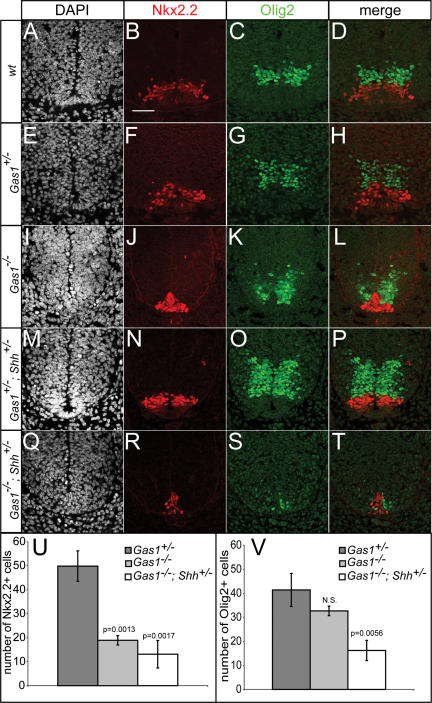
Figure 4.
Reduced Olig2+ and Nkx2.2+ cell specification in E10.5 Gas1; Shh compound mutants. DAPI (A,E,I,M,Q), Nkx2.2 (red; B,F,J,N,R), and Olig2 (green; C,G,K,O,S) detection in forelimb-level E10.5 sections of Gas1; Shh embryos. (D,H,L,P,T) Nkx2.2 and Olig2 merged images are shown. Quantitation of numbers of Nkx2.2+ (U) and Olig2+ (V) cells in Gas1+/− (dark-gray bars), Gas1−/− (light-gray bars), and Gas1−/−; Shh+/− (white bars) E10.5 embryos. Error bars represent the mean ± SD of three different embryos. P-values calculated from comparison with Gas1+/− data by two-tailed Student’s t-test are listed. (N.S.) Not significant (p > 0.1). Bar: B, 50 μm.

