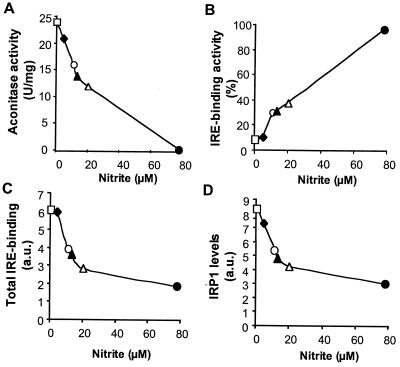
Figure 2.
Converse modulation of IRP1–IRE binding activity and IRP1 expression in RAW 264.7 cells in response to increasing concentrations of INF-γ and LPS. Cells were grown for 16 h in the presence of 10 units/ml IFN-γ (⧫), 100 units/ml IFN-γ (▴), 10 ng/ml LPS (○), 100 ng/ml LPS (▵), 10 units/ml IFN-γ + 50 ng/ml LPS (●), or without any stimulus (□). NO production was measured by assessing nitrite in the culture medium. (A) Aconitase activity was analyzed by spectrophotometry. (B) IRP1–IRE binding activity was analyzed by EMSA as described in Materials and Methods. Radioactivity associated with IRP1–IRE complexes was quantified by PhosphorImaging. IRP1–IRE binding activity is expressed as the percentage of the value obtained in the presence of 2% 2-ME. (C) Total IRP1–IRE binding capacity obtained in the presence of 2% 2-ME is expressed in arbitrary units. (D) IRP1 levels were analyzed by Western blotting and quantified by densitometry.

