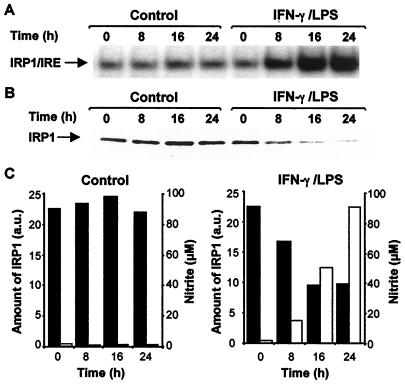
Figure 3.
Time course of IRP1 down-regulation in RAW 264.7 cells stimulated with IFN-γ and LPS. Cells were cultured in the presence of 10 units/ml IFN-γ plus 50 ng/ml LPS or without any stimuli for different times. NO production was assessed by measuring nitrite (empty bars) in the culture medium. (A) IRP1–IRE binding activity was analyzed by EMSA. (B) Equal amounts of protein (10 μg) were subjected to Western blot analysis using an anti-IRP1 antiserum. (C) IRP1 levels (filled bars) were quantified by densitometry.

