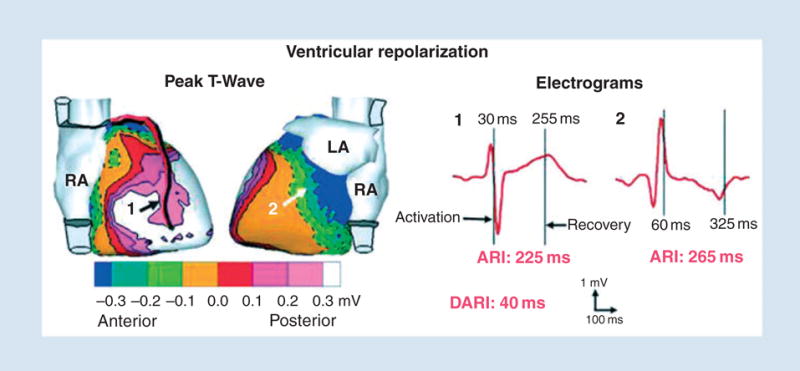
Fig. 12.

Noninvasive ECGI images of ventricular repolarization. Left: Epicardial potentials. Numbers indicate locations of electrograms shown on the right. Right: Examples of ECGI reconstructed electrograms on right ventricle (1) and left ventricle (2) epicardium. Vertical lines mark activation and recovery times. ECGI, electrocardiographic imaging; ARI, activation recovery interval; DARI, difference in ARI between locations 2 and 1. Reproduced from Ramanathan et al. [5].
