
Fig. 4.
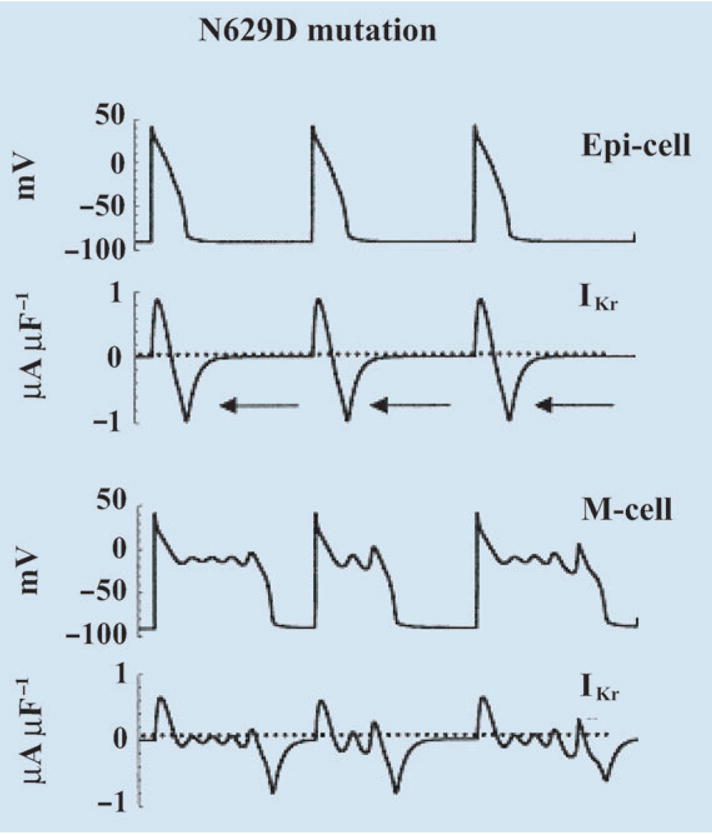
Simulation of HERG N629D mutation. Action potential (AP) and IKr during the AP are shown for epicardial cell (top) and M cell (bottom). Adapted with permission from Clancy and Rudy [3].
Official websites use .gov
A
.gov website belongs to an official
government organization in the United States.
Secure .gov websites use HTTPS
A lock (
) or https:// means you've safely
connected to the .gov website. Share sensitive
information only on official, secure websites.
Simulation of HERG N629D mutation. Action potential (AP) and IKr during the AP are shown for epicardial cell (top) and M cell (bottom). Adapted with permission from Clancy and Rudy [3].