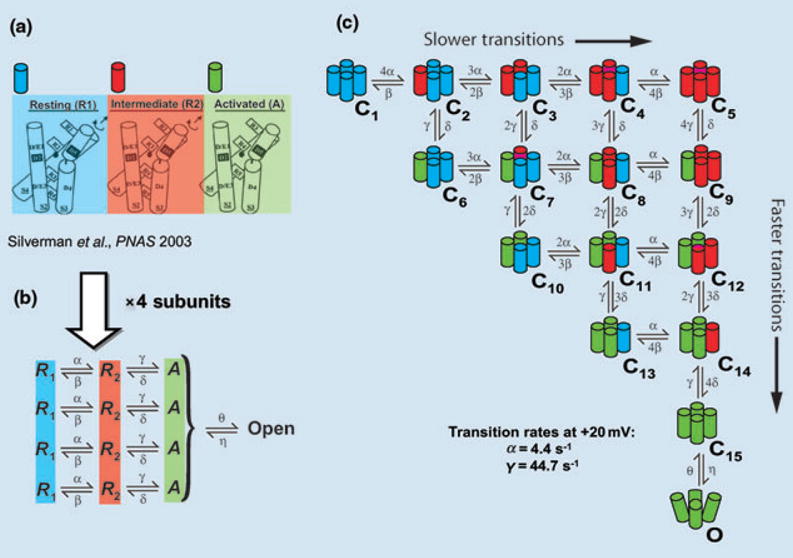
Fig. 6.

Conformational changes of IKs during activation. (a) Structural basis for two voltage sensor transitions before channel opening [26]. (b) Kinetic representation of the two voltage sensor transitions in panel a; all four α subunits that form the channel undergo a first transition from a resting state (R1) to an intermediate state (R2) and a second transition from R2 to an activated state (A). Once all voltage sensors are in the activated state, the channel can open. (c) All combinations of voltage sensor states in the four subunits can be represented by 15 closed states before channel opening. Blue, red, green indicate a voltage sensor in state R1, R2 or A respectively. Panel a is based on data from the ether –á-go-go (eag) and Shaker K+ channels and is adapted with permission from reference Silverman et al. [26].
