
Fig. 8.
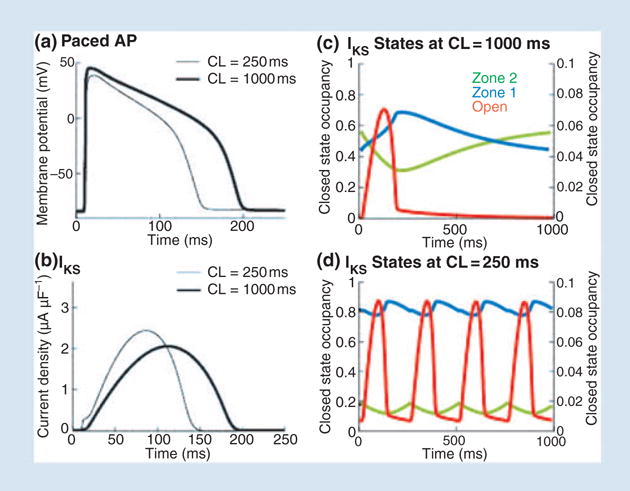
Role of IKs in rate-adaptation of action potential (AP) duration. (a) AP during pacing at slow (CL = 1000 ms, thick line) and fast (CL = 250 ms, thin line) rate. (b) Corresponding IKs, computed using a guinea-pig-based model of the current. (c) State occupancy in zone 2 (green), zone 1 (blue) and in the open state (red) during the AP at slow rate. (d) State occupancy at fast rate (same format as panel c); note accumulation in zone 1. Reproduced with permission from Silva and Rudy [4].