
Figure 1.
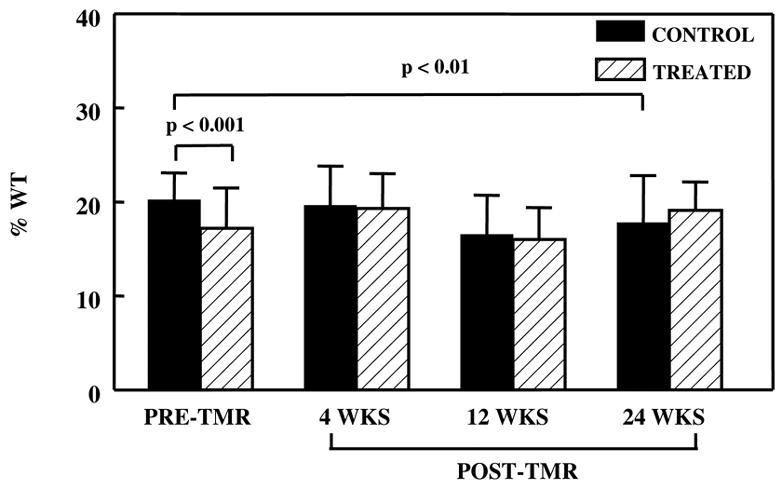
Resting WT in the control and treated regions before and after TMR. In the control region, there was a reduction in WT at 24 weeks post-TMR when compared to pre-TMR. In the treated region, there was no appreciable change.
Official websites use .gov
A
.gov website belongs to an official
government organization in the United States.
Secure .gov websites use HTTPS
A lock (
) or https:// means you've safely
connected to the .gov website. Share sensitive
information only on official, secure websites.
Resting WT in the control and treated regions before and after TMR. In the control region, there was a reduction in WT at 24 weeks post-TMR when compared to pre-TMR. In the treated region, there was no appreciable change.