
Figure 5.
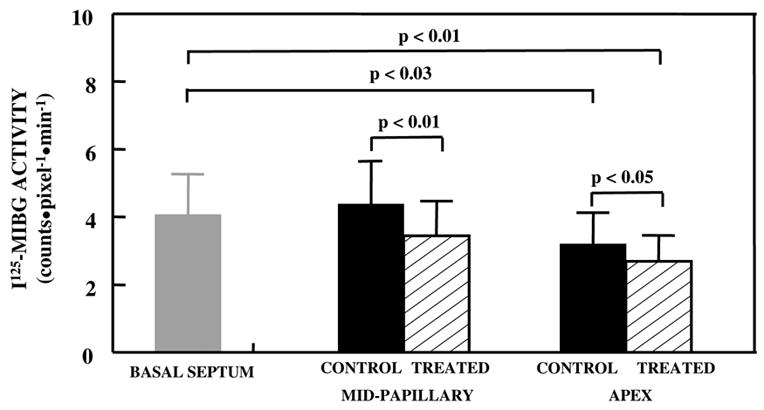
Quantitative 123I-MIBG uptake in the basal IVS, papillary muscle, and apical levels. At the apex, there were significantly reduced counts in the control and TMR-treated regions compared to the basal IVS. At both the papillary muscle and apical levels, the treated region had significantly lower uptake when compared to the control region.