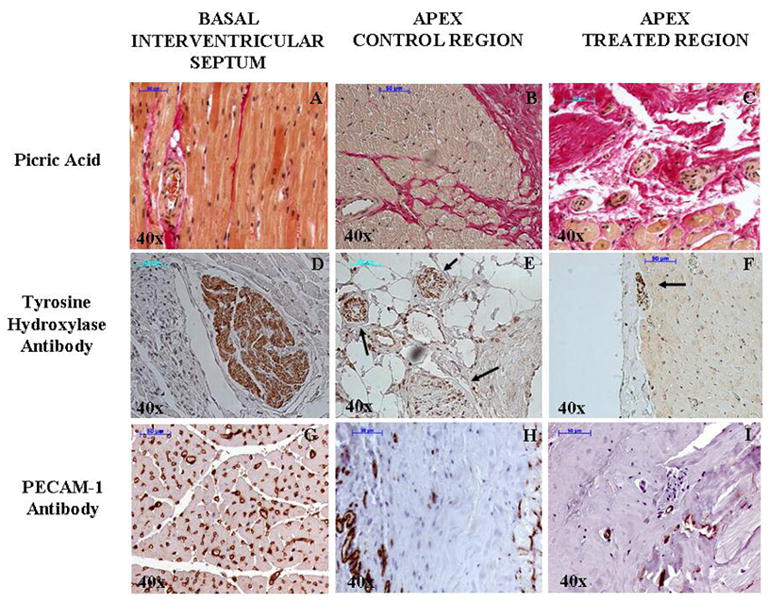
Figure 6.

Representative picric acid (A, B, and C), tyrosine hydroxylase antibody (D, E, and F), and PECAM-1 antibody (G, H, and I) staining of myocardial tissue at the basal inter-ventricular spetum and apical levels (control and treated) at 40x magnification. There is significant fibrosis (red) with corresponding reduction of intact nor-adrenergic nerves (dark brown) and blood vessels density (brown) at the apex compared to the basal IVS. The arrows on panels E and F demonstrate nerve bundles with reduced staining.
