
Figure 3.
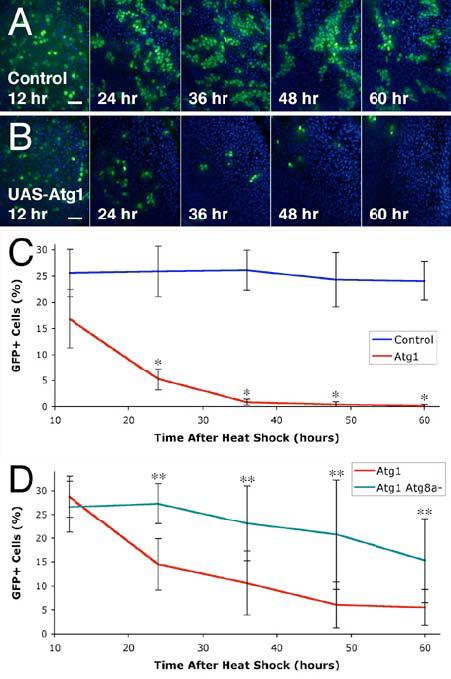
Overexpression of Atg1 leads to cell elimination.
(A-C) Elimination of Atg1 overexpressing clones in the wing disc. Wild type controls show consistent numbers of GFP positive cells at 12, 24, 36, 48, and 60 hours after induction by heat shock (A). Cells overexpressing Atg1 (GFP positive cells) are abundant 12 hours after heat shock, but are eliminated over time (B). Mean numbers of GFP-positive cells, expressed as a percentage of total cells (C). * indicates a significant difference from the wild type control: p < 0.0001.
(D) Mutation of Atg8a delays elimination of Atg1 overexpressing cells. Mean numbers of GFP-positive cells are expressed as a percentage of total cells. ** indicates a significant difference from Atg1 overexpression alone: p < 0.03.
Scale bars represent 10 μm. Nuclei are marked in blue. Error bars indicate SD.
Genotypes: (A) hsflp/+; Act>CD2>GAL4 UAS-GFP/+. (B) hsflp/+; Act>CD2>GAL4 UAS-GFP/UASAtg16B. (C) As in panels A & B. (D) Atg1: hsflp/Y; tub>CD2>GAL4/+; UAS-Atg16B/+. Atg1 Atg8a-: hsflp Atg8aKG07569/Y; tub>CD2>GAL4/+; UAS-Atg16B/+.