
Figure 4.
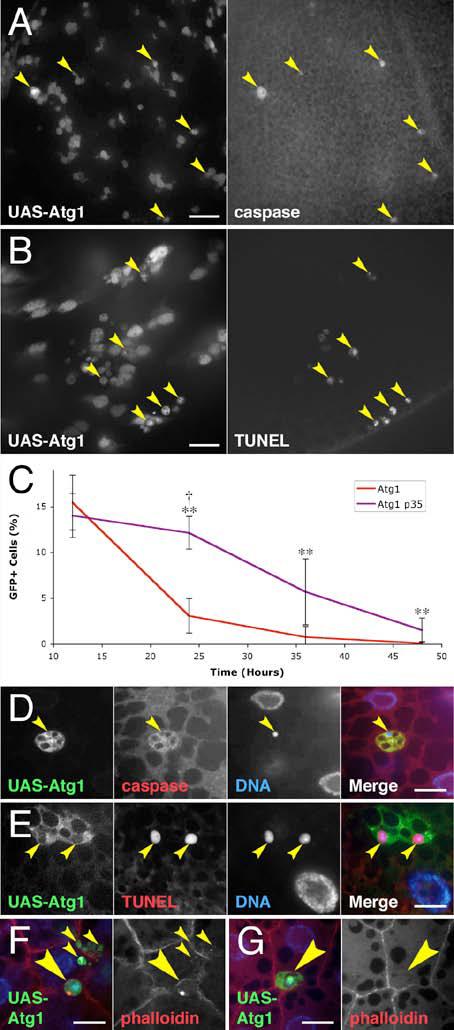
Atg1 overexpression induces apoptosis.
(A) Wing discs display active caspase 3 staining (arrowheads) in 20% (±15%, p = 0.007) of cells overexpressing Atg1 (GFP positive cells).
(B) Wing discs show DNA fragmentation in 22% (±6%, p = 0.0002) of Atg1 overexpressing cells (GFP positive cells) by TUNEL staining (arrowheads).
(C) Co-expression of p35 reduces elimination of Atg1 overexpressing cells. Mean numbers of GFP-positive cells are expressed as a percentage of total cells. ** indicates a significant difference from Atg1 overexpression alone: p < 0.020; † indicates no significant difference from the wild type control: p = 0.63.
(D-G) Fat body cells overexpressing Atg1 die by apoptosis. (D) An Atg1 overexpressing cell (arrowhead) staining for active caspase 3. (E) Atg1 overexpressing cells (arrowheads) staining positive for TUNEL. TUNEL and DNA channels show two representative confocal sections. (F) Atg1 overexpressing cells with aberrant actin staining (large arrowhead) or that have fragmented and been absorbed into neighboring cells (small arrowheads). (G) A cell overexpressing Atg1 (arrowhead) has lost most peripheral actin staining and has been completely engulfed by a neighboring fat body cell. Scale bars represent 10 μm. Nuclei are marked in blue. Error bars indicate SD.
Genotypes: (A-B, D-G) hsflp/+; Act>CD2>GAL4 UAS-GFP/UAS-Atg16B. (C) Control: hsflp/+; Act>CD2>GAL4 UAS-GFP/+. Atg1: hsflp/+; Act>CD2>GAL4 UAS-GFP/UAS-Atg16B. Atg1 p35: hsflp/+; Act>CD2>GAL4 UAS-GFP/UAS-Atg16B UAS-p35.