
Figure 5.
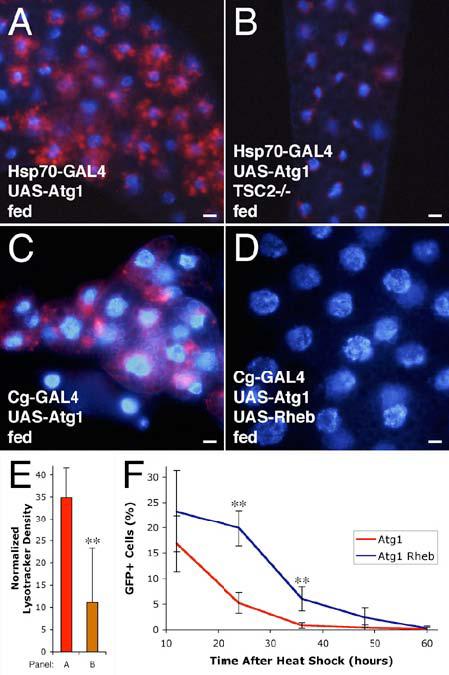
Regulation of Atg1 by TOR signaling.
(A-D) Atg1-induced autophagy is suppressed by activation of the TOR pathway. Heat shock-induced overexpression of Atg1 (A) induces autophagy as shown by Lysotracker staining (red), but mutation of TSC2 inhibits this induction (B). Overexpression of Rheb rescues Atg1 overexpression phenotypes. Overexpression of Atg1 throughout the fat body (C) results in variable reduction in cell size and induction of autophagy. Simultaneous overexpression of Rheb (D) rescues these effects.
(E) Quantitation of Lysotracker staining. ** indicates a significant difference from Atg1 overexpression alone: p = 0.0051.
(F) Co-expression of Rheb delays elimination of Atg1 overexpressing cells. Mean numbers of GFP-positive cells are expressed as a percentage of total cells. ** indicates a significant difference from Atg1 overexpression alone: p < 0.002.
Scale bars represent 10 μm. Nuclei are marked in blue. Error bars indicate SD.
Genotypes: (A) Hsp70-GAL4/UAS-Atg16B. (B) Hsp70-GAL4 gig192/UAS-Atg16B gig109. (C) Cg-GAL4/+; UAS-Atg1GS10797/+. (D) Cg-GAL4/+; UAS-Atg1GS10797/UAS-RhebEP50.084-loxP. (E) As in panels A & B. (F) Atg1: hsflp/+; Act>CD2>GAL4/UAS-Atg16B. Atg1 Rheb: hsflp/+; Act>CD2>GAL4/UAS-Atg16B UAS-RhebAV4.