
Figure 6.
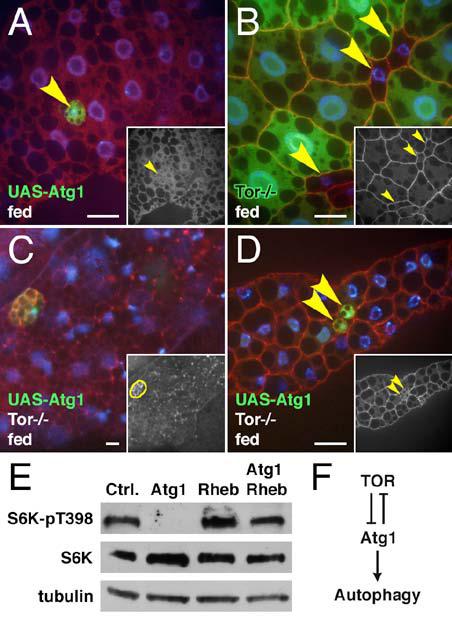
Feedback by Atg1 on TOR.
(A) Atg1 overexpression (GFP positive cell) does not cause FOXO (red) to localize to the nucleus (arrowhead). Inset shows FOXO channel.
(B) Tor null cells (loss of GFP, arrowheads) are 70% smaller than surrounding wild type cells; p < 0.0001. Inset shows phalloidin channel.
(C-D) Overexpression of Atg1 in a Tor mutant background. In Tor null animals, cells overexpressing Atg1 (GFP positive cells) show increased Lysotracker staining (C) and a 58% reduction in size (D); p = 0.0003. DNA channel in (D) shows three representative confocal sections. Inset in (C) shows Lysotracker channel with clonal boundaries outlines in yellow. Inset in (D) shows phalloidin channel; arrowheads indicate Atg1 overexpressing cells.
(E) Western blot showing a decrease in S6K phosphorylation in fat body from larvae overexpressing Atg1, but not from animals overexpressing both Atg1 and Rheb.
(F) Inhibitory feedback by Atg1.
Scale bars represent 10 μm. Nuclei are marked in blue.
Genotypes: (A) hsflp/+; Act>CD2>GAL4 UAS-GFP/UAS-Atg16B. (B) hsflp; TorΔP FRT40A/UAS-2x eGFP FRT40A fb-GAL4. (C) hsflp; TorΔP/TorΔP; Act>CD2>GAL4 UAS-GFP UAS-Atg1GS10797/+. (D) hsflp; TorΔP/TorΔP; Act>CD2>GAL4 UAS-GFP/UAS-Atg16B. (E) Control: Hsp70-GAL4/+. Atg1: Hsp70-GAL4/UAS-Atg16B. Rheb: Hsp70-GAL4/UAS-RhebEP50.084-loxP. Atg1 Rheb: Hsp70-GAL4/UAS-Atg16BUAS-RhebEP50.084-loxP.