
Figure 7.
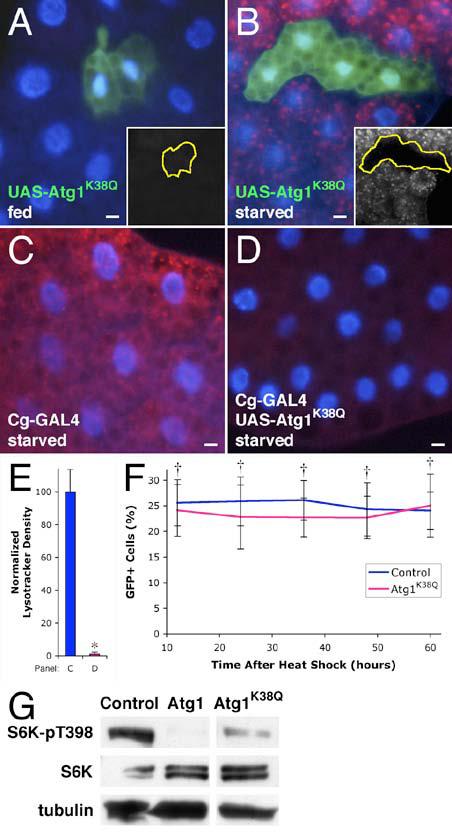
Induction of autophagy requires Atg1 kinase activity.
(A-D) Expression of kinase-defective Atg1 inhibits autophagy. Atg1K38Q expression has no effect on autophagy in fed animals (A), but cell autonomously inhibits induction of autophagy in the fat body of starved animals (B). Tissue-wide induction of autophagy by starvation (C) is inhibited by expression of kinase inactive Atg1 (D). Insets show the Lysotracker channel of the respective images, with clonal boundaries outlined in yellow.
(E) Quantitation of Lysotracker staining. * indicates a significant difference from wild type: p < 0.0001.
(F) Wing disc cells overexpressing kinase-defective Atg1 are not eliminated. Mean numbers of GFP-positive cells are expressed as a percentage of total cells. † indicates no significant difference from the wild type control: p > 0.1.
(G) Kinase-defective Atg1 leads to a modest reduction in TOR signaling. Nonconsecutive lanes are shown from the same Western blot.
Scale bars represent 10 μm. Nuclei are marked in blue. Error bars indicate SD.
Genotypes: (A-B) hsflp/+; Act>CD2>GAL4 UAS-GFP/UAS-Atg1KQ13A. (C) Cg-GAL4/+. (D) Cg-GAL4/+; UAS-Atg1KQ13A/+. (E) As in panels C & D. (F) Control: hsflp/+; Act>CD2>GAL4 UAS-GFP/+. Atg1K38Q: hsflp/+; Act>CD2>GAL4 UAS-GFP/UAS-Atg1KQ13A. (G) Control: Hsp70-GAL4 /+. Atg1: Hsp70-GAL4/UAS-Atg16B. Atg1K38Q: Hsp70-GAL4/UAS-Atg1KQ13A.