
Figure 2.
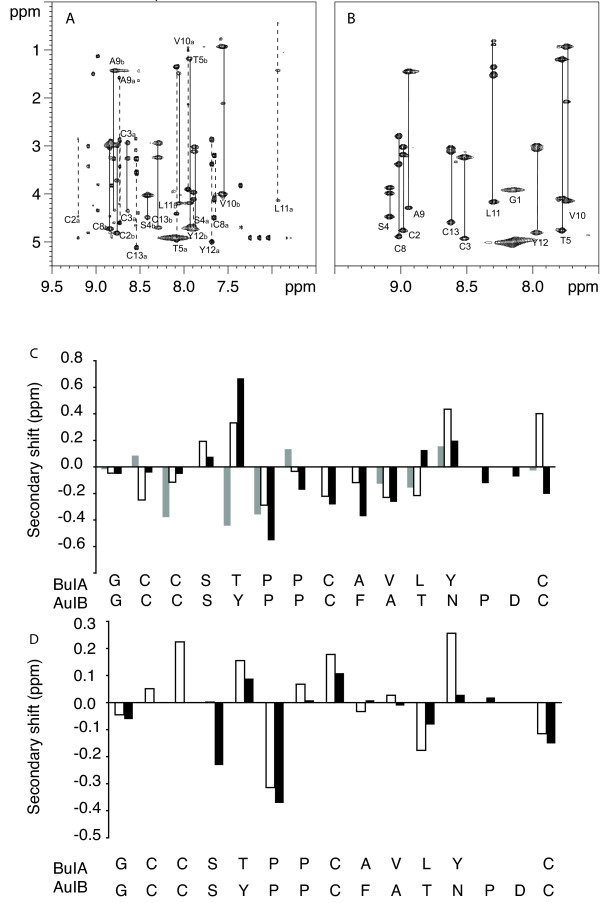
NMR analysis of ribbon and globular BuIA. The upper panels show the amide regions of the TOCSY spectra at 600 MHz of globular (A) and ribbon BuIA (B) at 282 K in 95% H2O/5% 2H2O at pH 3. The one letter code and the residue numbers are used for labeling. For globular BuIA (A) stretches of assigned residues are labeled, as a or b to indicate conformers A and B. The lower panels (C & D) show a secondary shift analysis of conformers A and B from globular BuIA and ribbon BuIA compared to AuIB. For each residue, represented by the one letter code, the differences between the actual chemical shifts for the α-protons and their respective random coil shifts are graphed. (C) Native AuIB (black bars), conformer A (white bars), conformer B (grey bars). (D) Ribbon AuIB (black bars), ribbon BuIA (white bars).