
Figure 6.
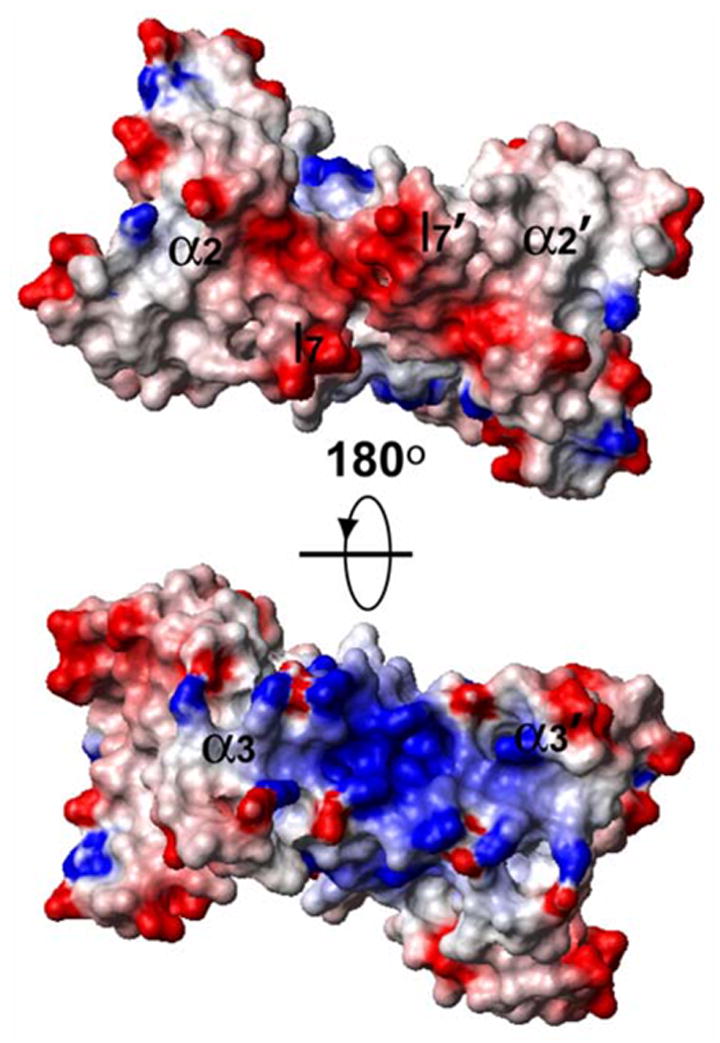
Representation of the surface electrostatic potential, with positive regions in blue and negative regions in red as calculated by the program MOLMOL.40
Official websites use .gov
A
.gov website belongs to an official
government organization in the United States.
Secure .gov websites use HTTPS
A lock (
) or https:// means you've safely
connected to the .gov website. Share sensitive
information only on official, secure websites.
Representation of the surface electrostatic potential, with positive regions in blue and negative regions in red as calculated by the program MOLMOL.40