
Figure 1. Analysis of bovine HMW adiponectin by analytical ultracentrifugation.
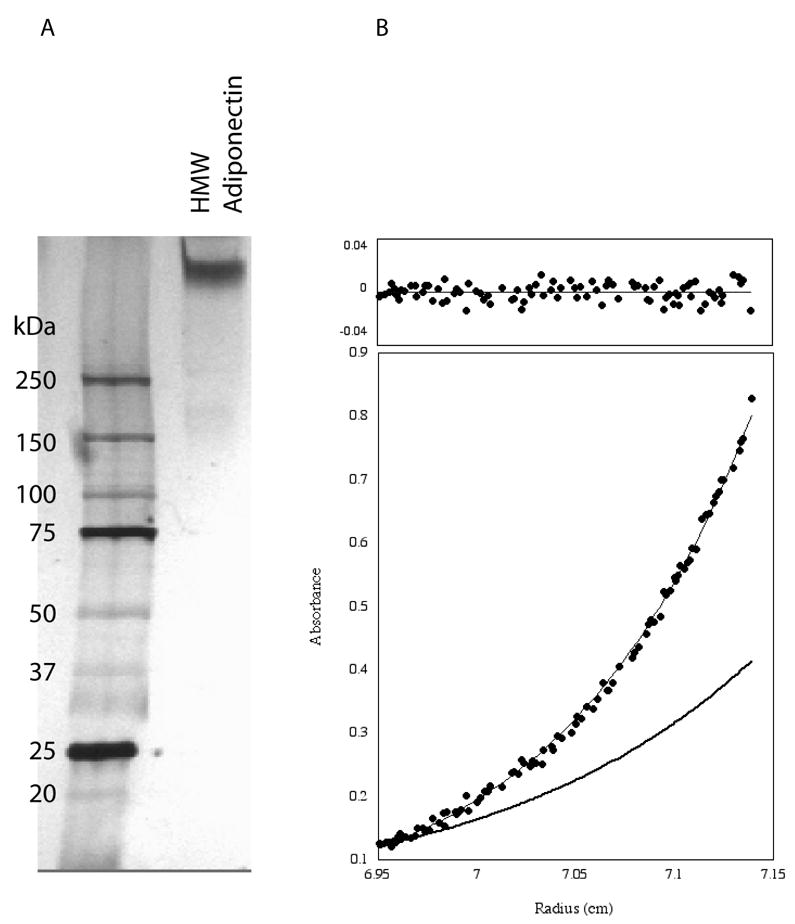
A. Electrophoretic analysis of purified bovine HMW adiponectin with silver staining. B. Sedimentation equilibrium trace of the purified complex. The data (circles) were fit using an ideal single species model and yielded an apparent molecular weight of 486 kDa. The residuals are shown above the trace. A theoretical curve (bold line) for a dodecamer is shown for comparison.