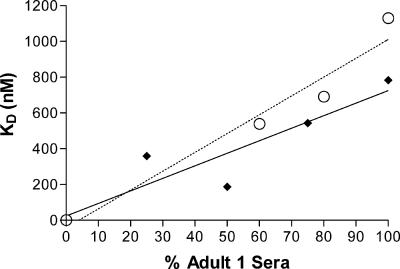
FIG. 2.
Linearity of inhibition ELISA. After normalizing for antibody concentration, serum from adult 1, which had a high KD, was mixed with serum from adult 3, which had a low KD, to produce a mixed serum with a linear gradient of KDs. The obtained KDs are plotted against the percentage of serum from adult 1 for each mixed serum. The results of two independent experiments are shown. Experiment 1, black diamonds and solid line (R2 = 0.83). Experiment 2, open circles and dashed line (R2 = 0.95).

