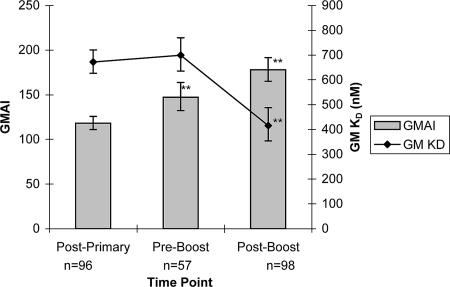
FIG. 3.
GM AI and GM KD for sera from children immunized with an MnC conjugate vaccine. Bars represent GM AI determined via chaotropic ELISA. Filled diamonds represent GM KD determined via inhibition ELISA for the same subjects. Error bars represent 95% confidence intervals for the geometric means. GM AI shows a significant increase at prebooster and postbooster time points, whereas GM KD shows a significant decrease (i.e., increased avidity) at the postbooster point only.

