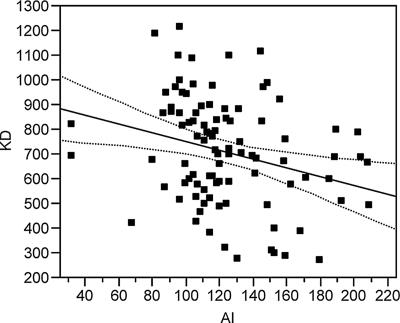
FIG. 4.
Correlation between KD and AI after primary-series immunization. At the post-primary-series time point, KD is 929.31 − 1.79 × AI (model F test: P = 0.0054 from the ANOVA table, with an R2 of 0.08). Data points are shown as squares and the regression function as a solid line. The dashed lines around the regression line represent the 95% confidence curves for the mean of KD.

