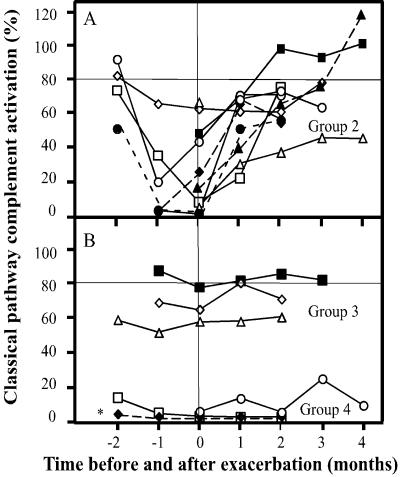
FIG. 3.
Alterations in CP activation in relation to disease activity in SLE. (A) Values from each time point for the patients in group 2 (n = 9), in which the CP activity decreased below 80% on one or more occasions. (B) Values for the patients in group 3 (n = 3), with moderate but stable activation, and group 4 (n = 3), with negligible activation. *, patient with a total C2 deficiency (patient 18 in Table 1).

