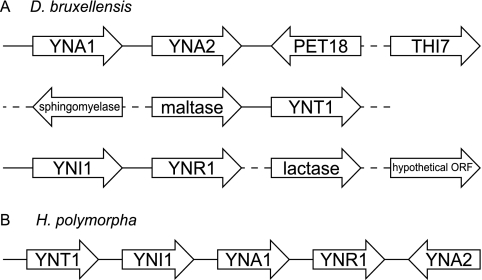
FIG. 4.
(A) Gene order relationships (not drawn to scale) of five nitrate assimilation genes and their neighboring genes in the D. bruxellensis data. See Table 2 for full gene names. The arrowheads indicate the direction of transcription. Solid lines between genes indicate sequenced intergenic regions; dotted lines indicate that the gene order is inferred from clone end pair information. (B) Order and orientation of the cluster of orthologous genes in Hansenula polymorpha (based on information provided in reference 4).

