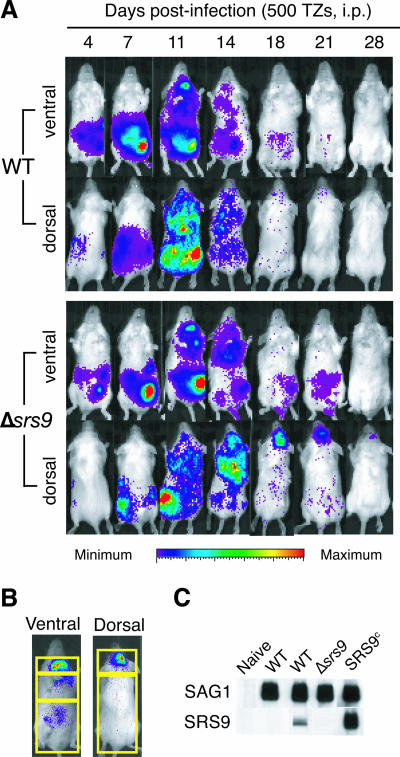
FIG. 2.
Growth, dissemination, and clearance of WT and Δsrs9 parasites in BALB/c mice infected i.p. with tachyzoites. (A) Eight-week-old BALB/c females were infected i.p. with 500 tachyzoites (TZs) of the WT or Δsrs9 strain, and BLI was performed at the indicated days after infection. Data for one representative mouse per strain are shown. BLI was done ventrally and then dorsally, with 5 min for each side. The amount of photon flux detected in individual pixels is displayed as pseudocolor images: red represents the most intense light emission (flux greater than 106 and 105 photons/s/cm2/steradian (sr) in ventral and dorsal images, respectively), and purple represents the weakest signal just above the background luminescence set to 6,000 photons/s/cm2/sr. (B) Regions of interest used to quantify photon flux in infected mice summarized in Table 1. Three regions assessed in ventral images are the neck area (includes cervical lymph nodes), chest area (includes the heart and lungs), and abdominal area (includes the liver, spleen, and intestine). Total ventral signal was defined as the sum of signals in these three areas. Brain signal was determined in dorsal images (top rectangle). The total dorsal signal was defined as the sum of signals in the two rectangles shown. (C) Western blots with chronic infection sera (6 weeks p.i.) obtained from BALB/c mice infected i.p. with the indicated parasite strains. Each nitrocellulose membrane strip contains 1 μg of boiled, nonreduced recombinant SAG1 (30 kDa) or recombinant SRS9 (37 kDa). All sera were used at 1:200 dilutions. The SRS9c strain expressing SRS9 in both tachyzoite and bradyzoite stages (11) was used as a positive control.

