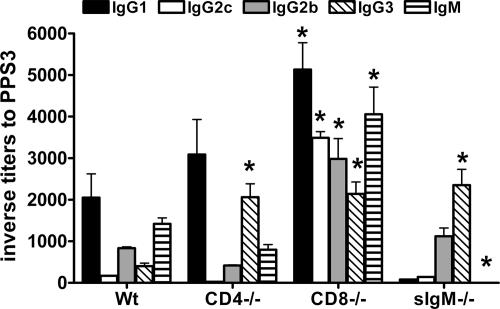
FIG. 1.
Serum isotype and IgG subclass profiles of PPS3-TT-immunized mice. Inverse titers to PPS3, determined by ELISA, are plotted on the y axis for the mouse strains indicated on the x axis. Mean values and standard deviations are shown for the indicated groups of five mice. Asterisks indicate P values of <0.05 by one-way ANOVA followed by Bonferroni's multiple-comparison test, comparing IS obtained 35 days after primary immunization from immunodeficient (CD4−/−, CD8−/−, or sIgM−/−) mice to IS from Wt (C57BL/6) mice. The data shown are from a representative experiment that was repeated three times, with similar results.

